The Rose Bowl is an Olympic venue again, and I have been running the experiment for sixteen years
Pasadena hands a small hotel one enormous compression event every January. The World Cup and Paris just confirmed what those Januaries taught me about what an event premium actually costs to collect.
Prash PatilAugust 25, 2026 · 13 min read
Every year on the first of January, the stretch of Colorado Boulevard outside our front desk closes to traffic before dawn. By the time the parade reaches us it has stopped performing and is essentially just driving east toward Sierra Madre Boulevard to be parked. We are one of the last things it passes.
That geography has handed us the same controlled experiment every year since 2010. One date produces demand that has nothing to do with anything we did, at a rate we could not command in July, inside a window narrow enough to count on one hand.
I had assumed that experiment was a local curiosity. Then I read the LA28 venue map.
Pasadena is a Games zone
The Rose Bowl is a competition venue for the 2028 Olympics. It sits in what the organising committee calls the Pasadena Zone, and it will be one of only two stadiums in the world to have hosted three Olympic Games, alongside the Los Angeles Memorial Coliseum. The official venue list puts football medal rounds there.
The dates are fixed. LA28 has the Olympic Games running July 14 to 30, 2028, with the Paralympics following August 15 to 27. Before that, Super Bowl LXI arrives at SoFi Stadium on February 14, 2027, which the Los Angeles Sports and Entertainment Commission confirmed when it took the handoff in February. It will be the ninth Super Bowl held in the greater Los Angeles region.
So between now and the summer of 2028, every owner in this basin is going to be handed a projection with an event premium built into it. Some of those projections will be for buildings a few miles from a venue that will be on television in every country on earth.
I am not going to tell you what those events will do to your rate. What I can tell you is what sixteen New Year's Days taught me about the gap between the number you ask for and the number you collect, and that two very large recent experiments have now said the same thing.
The World Cup just tested it at national scale
The tournament finished in July. The data is unambiguous, and it is not what the pre-tournament coverage promised.
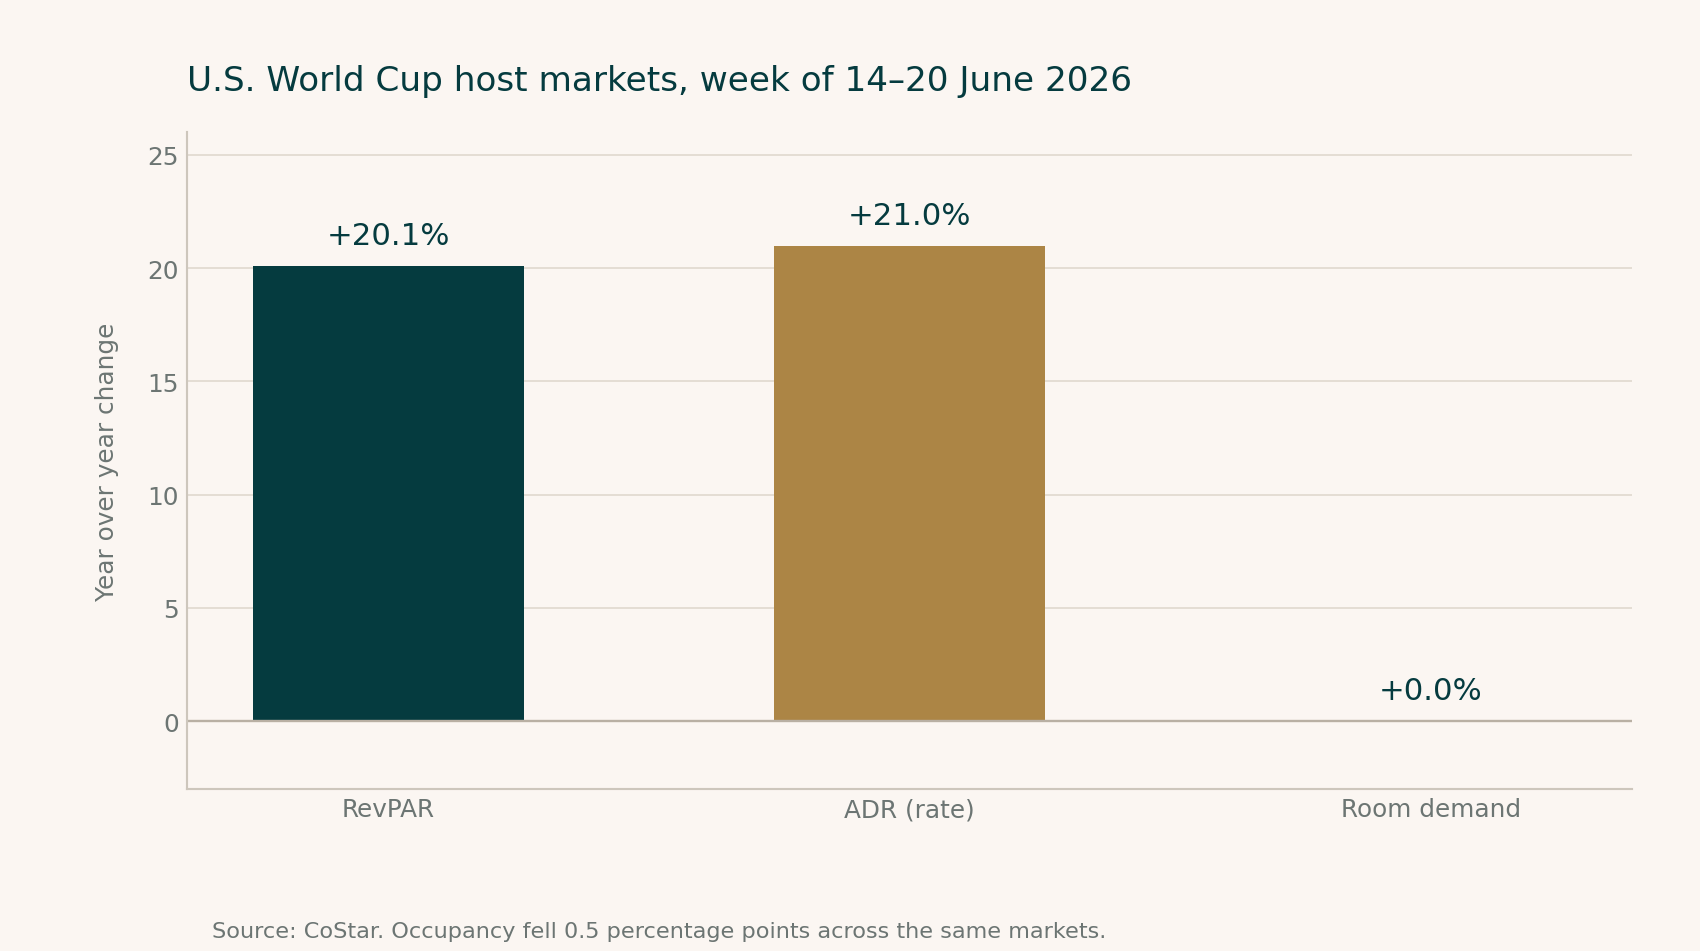
In the first full week of matches, June 14 to 20, CoStar reported that U.S. host markets combined for a 20.1 percent year-over-year increase in RevPAR on a 21 percent rise in average daily rate. Room demand was flat. Occupancy actually declined by half a percentage point.
Every dollar of that RevPAR gain came from rate. None of it came from
selling more rooms. Source: CoStar.
That pattern held. By the final week of the group stage, host markets posted a 16.7 percent RevPAR increase while hotel demand fell 2.9 percent. Across the first seventeen days of the tournament, occupancy in host markets ran 1.3 percentage points below the prior year.
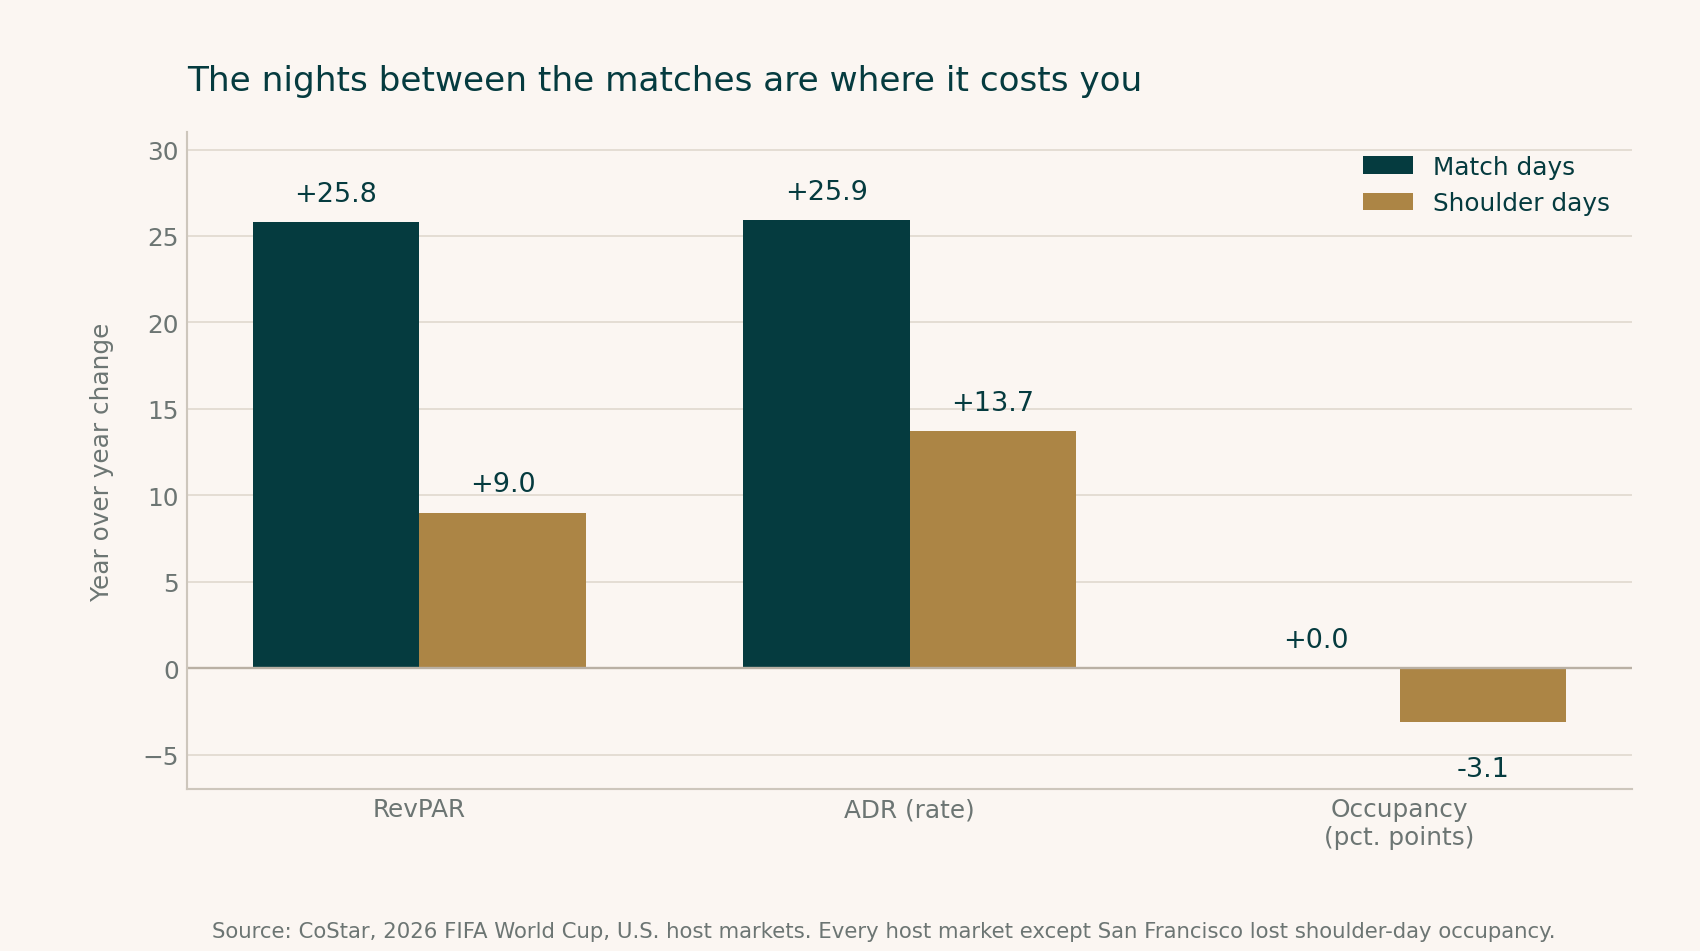
The most useful cut of the data separates match days from the days around them. On match days, RevPAR rose 25.8 percent on a nearly identical rate gain, with occupancy essentially unchanged. On the shoulder days between matches, RevPAR rose only 9 percent and occupancy fell more than three percentage points. Every host market except San Francisco lost occupancy on those in-between days.
Match nights held. The nights on either side of them did not.
Source: CoStar.
Meanwhile the strongest demand growth in the country was happening in markets that were not hosting anything at all.
HVS reached the same conclusion in its post-tournament market report, finding that the lift came through price rather than occupancy, and that aggressive pricing during match weeks pushed out rate-sensitive transient guests and moved group and meeting business to other dates or other cities.
Read that sentence again if you own a small property. The mechanism that produced the headline number is the same mechanism that emptied the shoulder nights. You cannot have one without the other. A revenue strategy that prices for the peak is, by construction, a strategy that thins out everything adjacent to the peak, and whether that trade is worth making depends entirely on how much adjacent business you had to begin with.
A large box with a strong group base has a great deal to lose. A twenty-one room property with a transient drive-in base has less to lose and less to gain. Neither of those is the property described in most of the coverage.
The booking window did not do what everyone expected
There is a second finding buried in this summer that matters more for planning than the rate numbers do.
Going into the tournament, the widely held assumption was that a mega-event compresses the booking window: demand arrives earlier, pace builds months out, and by spring you know what you have. That is the assumption underneath most event pro formas, because it is what makes an event feel forecastable.
It did not happen that way. Demand arrived late, behaved differently than the forward data suggested, and rewarded operators who adjusted in real time over those who set a plan in January and held it.
If you have ever run a property through a compression event, that will not surprise you, and it is the single most expensive thing to get wrong. A rate you set in March for a night in July is a bet on a booking curve. If the curve does not arrive when your model says it will, you are choosing between holding inventory into a window that may not fill and discounting into a market that would have paid more three days later. There is no good version of that decision. There is only the version where you built the flexibility in advance.
Paris ran it two years earlier
The 2024 Games produced the most extreme rate data anyone has recorded, and then produced the hangover.
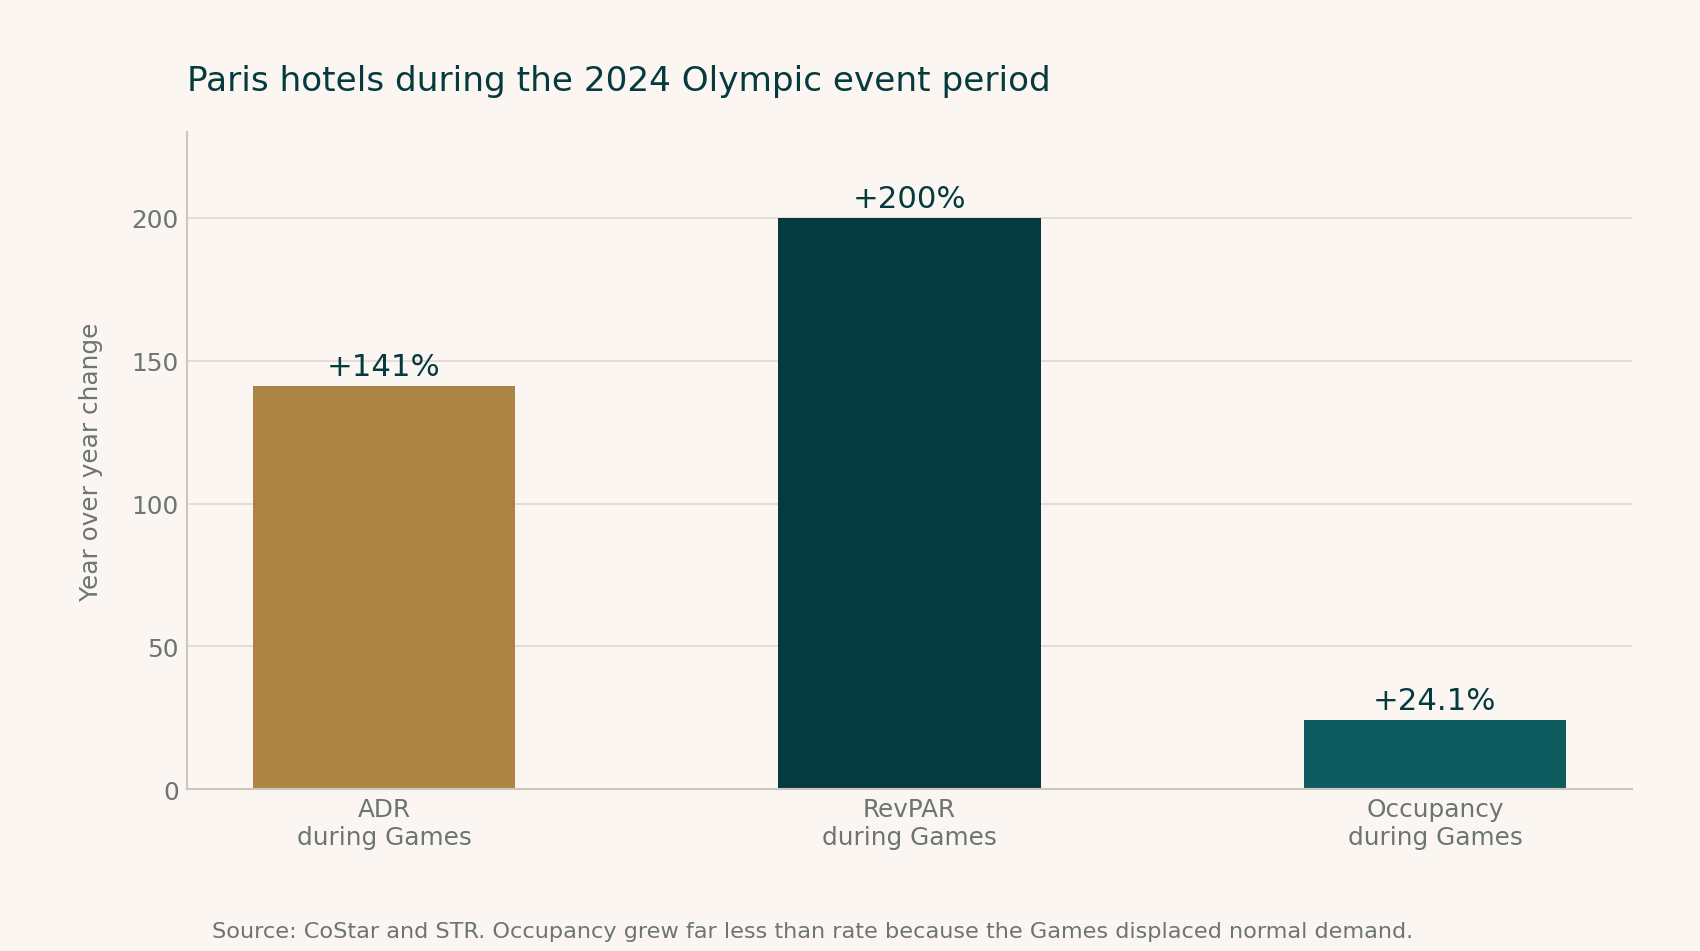
During the Olympic event period, CoStar and STR reported Paris ADR up 141 percent and RevPAR up 200 percent year over year. Opening night ADR hit €876.26, against a previous city record of €622 set in June 2023. Rates stayed above €700 for the rest of the Games.
Occupancy grew 24.1 percent. That is a large number in isolation and a small one next to 141 percent. STR's Samantha Mardkhah attributed the gap directly to displaced normal demand: inbound international arrivals, domestic travel, and group business that simply went elsewhere.
The shape is the whole lesson. Rate multiplied. Occupancy moved a
fraction as much, because the Games pushed out the business that was
already coming. Source: CoStar and STR.
The short-term rental side of that market is the cautionary tale. Research from eviivo and Key Data, summarised here, found demand up 229 percent during the Games but supply up 201 percent, and across the full summer of June through August, occupancy fell 4.9 percent and revenue per available rental dropped 24 percent against 2023. Everyone brought inventory to the party. The party was shorter than the inventory.
If you are being pitched a 2028 pro forma that treats the Olympics as pure upside, ask what it assumes about the supply that shows up alongside you.
The part that is specific to us
Here is where the analysis published for this region gets less useful the smaller you are, and where I think most owners in the San Gabriel Valley and Orange County are reading the wrong headlines.
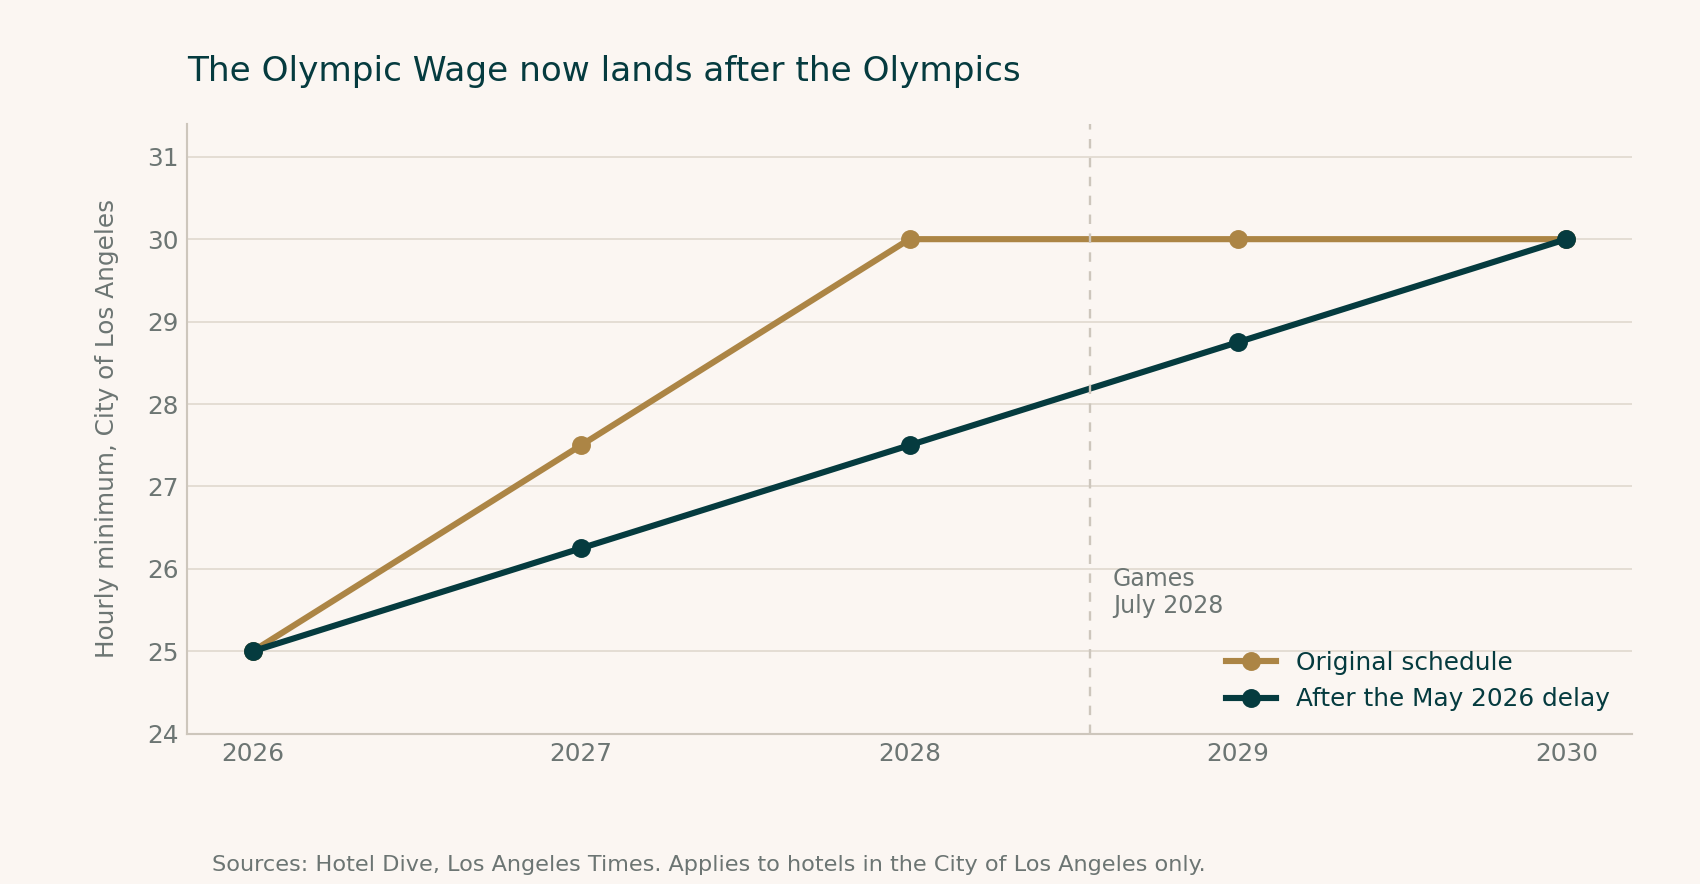
The Citywide Hotel Worker Minimum Wage Ordinance, known locally as the Olympic Wage, has dominated coverage of this market for two years. It took hotel workers to $25 an hour effective July 1 this year, and was originally written to reach $30 by July 2028, timed to land immediately before the Games. In May the City Council voted to delay full implementation to 2030.
The wage that was designed to arrive before the Olympics will now
arrive after them. Sources: Hotel Dive, Los Angeles Times.
The context around that vote is worth carrying. An American Hotel and Lodging Association survey from January found that 88 percent of Los Angeles hotels had laid off staff or cut hours during the prior year. An Employment Policies Institute analysis of Bureau of Labor Statistics figures found Los Angeles County's hotel and motel workforce down 1.7 percent in December 2025 against the year before.
Now the part nobody writes for us: that ordinance is a City of Los Angeles ordinance. Pasadena is its own city. Costa Mesa is its own city, in a different county. Neither of our properties is subject to it, and neither is any hotel in Glendale, Burbank, Long Beach, Anaheim, or most of the San Gabriel Valley.
That is not a loophole and it is not a boast. It is a planning fact with two edges. Our labour cost curve into 2028 is genuinely different from the one being modelled for a Downtown box, which matters when you are comparing acquisition targets across city lines. But it also means the coverage everyone is reading, the analyst notes, the association bulletins, the panels at conferences, is describing an operating environment that is not ours. If you own outside the City of Los Angeles and you are underwriting off Los Angeles headlines, you are working from the wrong inputs in both directions.
Check the jurisdiction of every regulation before you put it in a model. It sounds obvious. It is not what happens.
Orange County is a different question entirely
Our Costa Mesa property sits far enough from every announced venue that no reasonable model puts Olympic compression on it. What it does sit near is the fairgrounds, Segerstrom, South Coast Plaza, the colleges, John Wayne Airport, and a coastline two miles west.
That geography produces a different question. During the tournament this summer, the strongest demand growth in the country was in markets that were not hosting anything. Displaced business does not evaporate. It relocates, usually to somewhere close enough to be convenient and far enough to be affordable.
Whether Orange County is that somewhere during a Los Angeles Olympics is, to my knowledge, unanswered. I have not seen published analysis isolating non-host Southern California markets during this summer's tournament, and I am not going to assert a spillover the data has not shown. But it is the question I would be asking if I owned inventory between the two counties, and it is a materially different question from the one being asked about Downtown.
The honest position is that the displacement effect is well documented at national scale and completely unmeasured at the scale most of us operate at. That gap is where the actual opportunity and the actual risk both live.
What sixteen Januaries actually taught me
Our New Year's window is the highest rate we achieve all year by a wide margin, and it is roughly [X] percent of annual room revenue. That is a meaningful number and it is not a year. The distance between how large it feels in December and how small it looks on a trailing twelve statement is the most useful thing this building has taught me.
Three costs sit underneath every event premium and none of them appear in a pro forma.
The base you displace. Our ordinary early January demand is institutional and regional. Some of it will not book at a holiday rate, and some of it books elsewhere and does not return that quarter. Raising rate for the window is not adding a layer on top of normal business. It is substituting one guest for another, and the substitution has a price. The World Cup data is the same effect measured across eleven cities.
The cost of operating on the day. Street closures change deliveries, staff parking, and shift start times. Housekeeping availability on January 1 is a genuine constraint rather than a scheduling puzzle, and the turn cost that morning is the worst of the year. Modelling a rate spike without modelling what it costs to run the building during it is modelling half the transaction.
The week that follows. The days after our window are the softest of our year. Some of that is seasonal and would happen regardless. Some of it is the hangover from having priced everyone else out. Paris posted the same shape at national scale.
The rate you ask for eleven months out and the rate you collect are different numbers. The distance between them is the business.
There is a fourth thing that is not a cost but a trap. A compression event does not have one booking window, it has at least two, and they behave nothing alike. The parade audience books early and is organised about it months out. The bowl audience books late, because two fan bases often do not know until December whether they are coming, and when they find out they will pay a number that would embarrass you in July. Running one pricing strategy across both leaves money on the table in October or unsold inventory in the last week of December. We have done both.
What we are actually doing about it
Three things, none of them clever.
Not repricing the base yet. Our institutional and regional midweek business is the thing that pays the mortgage in the fifty-one weeks that are not the parade. Two years of writing about 2028 has not changed the fact that this business is what carries us, and pricing it out early to chase a rate that may not arrive is the failure mode I most want to avoid.
Building the flexibility instead of the forecast. Rather than trying to guess the 2028 curve, we are working on being able to respond to whatever curve shows up. Cleaner cancellation terms, minimum-stay rules we can turn on and off by date rather than by season, and honest visibility into what is on the books far enough out to act on it. None of that requires knowing what happens. All of it makes being wrong survivable.
Watching supply rather than demand. The Paris rental data is the part that keeps my attention. Demand can be enormous and still be outrun by the inventory that shows up to meet it. Between now and 2028 this basin will add short-term rental supply, repositioned rooms, and whatever else the projections encourage. The question that determines our outcome is not how many people come. It is how many rooms are competing for them.
Four questions for any 2028 projection
Does the deal work with the event removed entirely? If it only pencils with the Olympics in it, you have bought a lottery ticket with a roof on it.
What does the premium displace, and has that been netted out? A gross rate increase and a net revenue increase are different claims, and this summer produced the arithmetic to prove it.
What does the year after look like? Paris recalibrated. So did every host market before it. A model that runs event pricing into a normalised forward year is telling you a story.
Which city is the property actually in? Wage ordinances, occupancy taxes, and permitting are municipal. The map matters more than the metro.
One more, less about the model than the modeller. When you are shown an economic impact figure, ask who produced it. The Super Bowl LVI number circulating for this region, upwards of $477 million, comes from the host committee's own materials. That is not an accusation, it is a category. Economic impact and money reaching a hotel operating account are not the same measurement, and they are routinely quoted as though they were.
What I do not know
I own two small independents in one metropolitan area. My sample is one property on one boulevard across sixteen instances of one event. That does not generalise to a 400-key box beside a stadium and I would not pretend otherwise.
What it is good for is the shape of the thing, and the shape has now been confirmed twice at a scale I will never operate at. The premium arrives. It comes almost entirely through rate. It costs something to collect that nobody puts in the model. And the period after it ends is quieter than the period before it started.
Between now and July 2028 you will hear a great deal about how much money is coming to this region. A meaningful amount of it will be true.
Ask what it costs to collect.
Figures in brackets are drawn from our own operating records. All external data is linked to its source above and was accurate as published; market data is revised routinely, so check the current figure before relying on any of it in a model.
This article reflects the personal views and operating experience of the author at the time of writing. It is general commentary, not legal, tax, accounting, financial, or investment advice, and it is not an offer or solicitation of any kind. External figures are drawn from the sources cited and were accurate as published. Market conditions, program rules, and regulations change, and we do not commit to updating anything published here. Confirm anything you intend to rely on with a qualified professional.
The Newsletter
Notes from the field, now and then
Occasional writing on the Southern California lodging market from inside two independent hotels. No schedule, no filler, and nothing sold to you.
We will not share your address, and you can leave at any time.
In July the SBA doubled how much a single borrower can hold across its two main programs. For owner operators buying independent hotels, this is the most consequential change to the capital stack in a generation.